


Summary
To determine genetic and environmental impact on mandibular morphology using lateral cephalometric analysis of twins with completed mandibular growth and deoxyribonucleic acid (DNA) based zygosity determination.
The 39 cephalometric variables of 141 same gender adult pair of twins were analysed. Zygosity was determined using 15 specific DNA markers and cervical vertebral maturation method was used to assess completion of the mandibular growth. A genetic analysis was performed using maximum likelihood genetic structural equation modelling (GSEM).
The genetic heritability estimates of angular variables describing horizontal mandibular position in relationship to cranial base and maxilla were considerably higher than in those describing vertical position. The mandibular skeletal cephalometric variables also showed high heritability estimates with angular measurements being considerably higher than linear ones. Results of this study indicate that the angular measurements representing mandibular skeletal morphology (mandibular form) have greater genetic determination than the linear measurements (mandibular size).
The shape and sagittal position of the mandible is under stronger genetic control, than is its size and vertical relationship to cranial base.
Introduction
The mandibular growth modification is based on the knowledge that genetic and environmental factors are both responsible for its size and form ( 1 ). Nevertheless, the data concerning genetic determination of malocclusion and mandibular morphology are inconsistent. The genetic mechanisms, specific genes leading to a particular skeletal variability are not completely understood and clear ( 2 ). Technological advances have now made association analysis possible on a genome-wide level, but usually before starting to look for a quantitative trait loci for complex traits, it is critical to know that there is a significant component of genetic variation present ( 3 ). The classical twin study model provides a powerful tool to confirm the presence of this genetic effect ( 4 ). Therefore, twin studies can shed some light on the role of genes and environment on mandibular phenotypic variation ( 5 ).
A basic problem with previous twin studies is the reliability of the twin zygosity diagnostics. For many years, zygosity determination was based on assessment of anthropological similarity including tooth anatomy ( 5 ). Although comparison of physical appearance can provide a reasonably reliable means of determining zygosity, errors can occur up to 15–20% with this methodology ( 6 ). The use of blood group determination, as well as serum and enzyme polymorphism analysis, improved the ability to assign zygosities to twins ( 4 ). More recently, the use of highly polymorphic regions of deoxyribonucleic acid (DNA) derived from blood or buccal cells has proved to accurately measure zygosity in up to 90–95% of cases ( 7 ). The more precise determination requires an increased number of highly polymorphic regions of DNA.
The second problem with twin studies relevant to mandibular morphology is maturity of the study sample. The vast majority of studies analyse data from growing subjects ( 1 , 8–11 ), twins who have just passed their peak of pubertal growth spurts ( 12 ) or use age-adjusted measurements to simulate completed growth of the mandible ( 13 ). The results of such studies on mandibular morphology heritability estimates should be interpreted with caution, because complete genetic predisposition of mandibular morphology can be detected only if mandible growth is completely finished.
The third problem lies within the statistical methods used to analyse the twin data. The path analysis and Dahlberg quotient used in the 1980s are not appropriate for today’s studies and model fitting methods should be used to get more accurate data.
The purpose of this study was to determine genetic and environmental impact on mandibular morphology using model fitting statistical analysis of lateral cephalometric variables of twins with completed mandibular growth and zygosity determination based on 15 highly polymorphic DNA regions and Amel fragment of amelogenin gene.
Materials and methods
Study sample
The twins participated in this study were from the Twin centre of Lithuanian university of health sciences. This ongoing register already covers more than 600 twin pairs voluntary registered and willing participate in different medical and genetic studies. All twins of this register were offered free of charge medical consultations including dental and orthodontic consultations. As part of dental and orthodontic examination lateral head cephalograms were taken. The study sample consisted of lateral cephalograms of 141 same gender pair of twins. All twins were Europeans, had no previous orthodontic treatment or permanent dental extractions and had not suffered any facial trauma. The protocol of the studies has been approved by the Regional Ethical Committee and informed consent was given by the twins and their parents.
The cervical vertebral maturation (CVM) method was used to assess the completion of the mandibular growth ( 14 ). Only twins which had attained the CVM stage 6 (active growth completed) were included in the study sample.
Zygosity determination was carried out using DNA test. The polymerase chain reaction set AmpFlSTR® Identifiler® (Applied Biosystems) was used to amplify short tandem repeats and 15 specific DNA markers (D8S1179, D21S11, D7S820, CSF1PO, D3S1358, TH01, D13S317, D16S539, D2S1338, D19S433, vWA, TROX, D18S51, D5S818, and FGA) and Amel fragment of amelogenin gene were used for comparison of genetic profiles. The sample’s age, gender, and zygosity characteristics are shown in Table 1 .
Study sample: age (years), zygosity, and gender of twin pairs.
| Twins | n | Age | |||
|---|---|---|---|---|---|
| Mean | SD | Min | Max | ||
| MZ | 90 | 22.45 | 5.81 | 15.3 | 39.6 |
| Male | 29 | 22.1 | 4.82 | 15.8 | 36.4 |
| Female | 61 | 22.62 | 6.25 | 15.3 | 39.6 |
| DZ | 51 | 20.47 | 3.78 | 15.4 | 37.8 |
| Male | 20 | 21.2 | 3.36 | 15.4 | 29.3 |
| Female | 31 | 20.0 | 4.01 | 15.5 | 37.8 |
| Total | 141 | 21.73 | 5.24 | 15.3 | 39.6 |
Cephalometric measurements
The cephalograms were taken in centric occlusion and cephalostat was used to maintain the subject’s head in constant relationship to the sensor. To minimize radiation doze digital panoramic systems were used and ALARA radiation safety principle was followed. All radiographs were analysed by the same investigator (MS) using commercially available software (Dolphin Imaging 11.7 Premium). Cephalometric landmarks presented in the Figure 1 and cephalometric variables in the Table 2 .
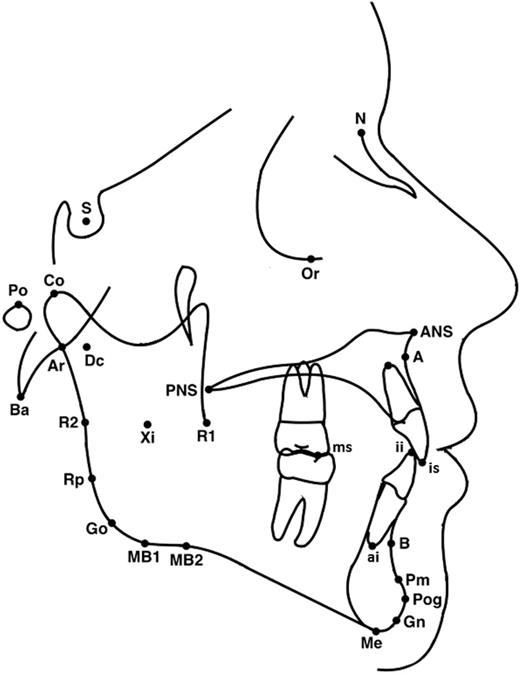
Cephalometric landmarks used in the study. S, Sella - the midpoint of sella turcica; N, Nasion - the extreme anterior point of the frontonasal suture; Ba, Basion - the most anterior-inferior point on the margin of the foramen magnum; A, point A - the deepest point in the curvature of the maxillary alveolar process; B, point B - the deepest point in the curvature of the mandibular alveolar process; ANS, point ANS - the tip of the anterior nasal spine; PNS, point PNS - the tip of the posterior nasal spine; Co, Condylion - the most posterior superior point of the condyle; Ar, Articulare - the point at the junction of the posterior border of the ramus and the inferior border of the posterior cranial base; Rp, ramus posterior point - the most prominent postero-superior point at the angle of the mandible on the posterior ramus; R1, ramus point 1 - the most concave point on the interior of the ramus; R2, ramus point 2 - the most convex point on the exterior border of the ramus along the vertical; Pog, Pogonion - the most anterior point of the chin; Me, Menton - the most inferior point of the chin; Go, Gonion - the midpoint of the mandibular angle between ramus and the mandibular corpus; MB1, inferior border point - the most convex point along the inferior border of the ramus; MB2, antegonial notch: the highest point of the notch of the lower border of the body of the mandible; Gn, Gnathion - the midpoint between Pog and Me on the bony chin; Xi, Xi point - the point located at the geometrical center of the ramus; Dc; Dc point - the point representing the center of the neck of the condyle on the Ba-N line; Pm, protuberance menti - the point at which the shape of symphysis mentalis changes from convex to concave; ai, apex inferior - the root apex of the most anterior mandibular central incisor; is, incision superior - the incisal tip of the most anterior maxillary central incisor; ii, incision inferior - the incisal tip of the most anterior mandibular central incisor; ms, molar superior - tip of the mesial buccal cusp of the mandibular first molar; Po, Porion - midpoint on upper contour of external auditory canal; Or, Orbitale - deepest point on infraorbital margin.
Cepahlometric variables and definitions used in the study.
| Variables | Definitions |
|---|---|
| Angular | |
| SNA | Angle determined by points S, N, and A. |
| SNB | Angle determined by points S, N, and B. |
| SNPog | Angle determined by points S, N, and Pog. |
| NSBa | Angle determined by points N, S, and Ba. |
| NSAr | Angle determined by points N, S, and Ar. |
| NAPog | Angle determined by points N, A, and Pog. |
| SN–GoMe | Angle formed by S–N and Go–Me lines. |
| ANSPNS–GoMe | Angle formed by ANS–PNS and Go–Me lines. |
| SN–ArRp | Angle formed by S–N and Ar–Rp lines. |
| PoOr–GoMe | Angle formed by Po–Or and Go–Me lines. |
| NGnGo | Angle determined by points N, Gn, and Go. |
| DcXiPm | Angle formed by Dc, Xi, and Pm points. |
| ArRp–MB1Me | Angle formed by Ar–Rp and MB1–Me lines. |
| CoGoMe | Angle determined by points Co, Go, and Me. |
| ArGoMe | Angle determined by points Ar, Go, and Me. |
| ai.ii–NB | Angle formed by line ai-ii and N–B lines. |
| ai.ii–GoMe | Angle formed by line ai-ii and Go–Me lines. |
| Linear | |
| CoA | Distance between points Co and A in mm. |
| CoGo | Distance between points Co and Go in mm. |
| CoPog | Distance between points Co and Pog in mm. |
| CoB | Distance between points Co and B in mm. |
| ArB | Distance between points Ar and B in mm. |
| ArA | Distance between points Ar and A in mm. |
| Pog ⊥ NB | Perpendicular distance from the point Pog to N–B line in mm. |
| GoGn | Distance between points Go and Gn in mm. |
| GoPog | Distance between points Go and Pog in mm. |
| XiPm | Distance between points Xi and Pm in mm. |
| R1R2 | Ramal width at Xi, distance between points R1 and R2 in mm. |
| NMe | TAFH, total anterior face height, distance between points N and Me in mm. |
| NANS | UAFH, upper anterior face height, distance between points N and ANS in mm. |
| ANSMe | LAFH, lower anterior face height, distance between points ANS and Me in mm. |
| SGo | TPFH, total posterior face height, distance between points S and Go in mm. |
| ii ⊥ NB | Perpendicular distance from point ii to N–B line in mm. |
| ii ⊥ APog | Perpendicular distance from point ii to A-Pog line in mm. |
| ii ⊥ GoMe | Perpendicular distance from point ii to Go–Me line in mm. |
| ms ⊥ GoMe | Perpendicular distance from point ms to Go–Me line in mm. |
| OB | Overbite: distance of vertical overlap of the lower incisors (point ii) by the upper central incisors (point is) in mm |
| OJ | Overjet: distance from the tip of the upper central incisor (point is) to the lower incisor (point ii) in mm. |
| MB2 ⊥ MB1Me | Depth of antegonial notch, perpendicular distance from the line between points MB1 and Me to the point MB2 in mm. |
Statistical analysis
Statistical analyses were performed with the R.v.3.1.2 software environment ( http://www.r-project.org ). Probabilities below 0.05 were considered statistically significant. All the analyses were calculated on gender adjusted cephalometric measurements ( 15 ).
Method error
Intra-observer method error was assessed using coefficient of reliability and a method suggested by Bland and Altman ( 16 ). The reliability of the method was tested by tracing and measuring 20 randomly selected lateral cephalograms twice with a 1-month time interval.
Estimation of heritability
Heritability is usually defined as the proportion of phenotypic variation that is due to genetic differences. Two types of heritability can be distinguished: ‘narrow-sense heritability’ refers to the contribution of additive genetic variance to observed phenotypic variance, whereas ‘broad-sense’ heritability refers to total contribution of genetic factors (additive and non-additive) to observed variation ( 4 ). The genetic analysis by model fitting was done with OpenMx package ( http://openmx.psyc.virginia.edu ) and performed using maximum likelihood genetic structural equation modelling (GSEM) ( 17 ). This analysis allows estimation of the significance of the different components of variance: the additive genetic factor (A), the shared environment (C), or the non-additive genetic factor (D), and the unique environment (E). Univariate ACE/ADE models were executed with standardized path coefficients and expected variance and covariance matrices. The goodness of fit of the full and reduced ACE/ADE models was compared with a univariate saturated twin model imposing equal means and variance restriction across twins and zygosity to maximize information. It should be noted that the power of the sample was sufficient to detect additive genetic influence (narrow-sense heritability), but might to low to detect dominance or shared environment, unless the effect was large.
The Akaike information criterion (AIC) statistics ( 18 ) and the difference in the chi-square (χ 2 ) value relative to the change in degrees of freedom provided an indication of the models’ goodness of fit. The most parsimonious model (lowest AIC value) to explain the observed variance was selected.
Principal component analysis
Principal components analysis (PCA) was performed using ‘Psych package’ (Procedures for Psychological, Psychometric and Personality research: http://cran.r-project.org/web/packages/psych/index.html ) on 39 cephalometric measurements in order to establish whether they could be reduced to a smaller number of components. The number of components was determined by selecting all components with an eigenvalue larger than 2. A variable belonged to a component if the absolute value of the component loading was larger than 0.5. Principal components were rotated using varimax rotation.
Results
Method error
There were no significant differences between the first and the second measurements of cephalometric variables, except for Xi-Pm and OB ( Table 3 ).
Method error by Bland–Altman for repeatability of the cephalometric measurements and its statistical significance.
| Cephalometric variables | SE | P |
|---|---|---|
| Mandibular relationship to cranial base and maxillary structures | ||
| SNA (°) | 0.60 | NS |
| SNB (°) | 0.40 | NS |
| SNPog (°) | 0.40 | NS |
| NSBa (°) | 1.14 | NS |
| NSAr (°) | 1.14 | NS |
| NAPog (°) | 0.89 | NS |
| SN–GoMe (°) | 0.88 | NS |
| ANSPNS–GoMe (°) | 0.91 | NS |
| NMe (mm), TAFH | 0.76 | NS |
| NANS (mm), UAFH | 0.68 | NS |
| ANSMe (mm), LAFH | 0.78 | NS |
| CoA (mm) | 1.24 | NS |
| ArA (mm) | 0.56 | NS |
| SNArRp (°) | 0.93 | NS |
| PoOrGoMe (°) | 1.20 | NS |
| NGnGo (°) | 0.54 | NS |
| SGo (mm), TPFH | 0.83 | NS |
| Mandibular skeletal variables | ||
| DcXiPm (°) | 1.93 | NS |
| CoGoMe (°) | 1.49 | NS |
| CoB (mm) | 1.73 | NS |
| ArB (mm) | 0.99 | NS |
| GoGn (mm) | 0.84 | NS |
| XiPm (mm) | 0.59 | 0.01 |
| R1R2 (mm) | 0.68 | NS |
| MB2 ⊥ MB1Me (mm) | 0.32 | NS |
| CoPog (mm) | 1.41 | NS |
| ArRp–MB1Me (°) | 0.71 | NS |
| ArGoMe (°) | 1.30 | NS |
| CoGo (mm) | 1.55 | NS |
| GoPog (mm) | 0.78 | NS |
| Dento-alveolar variables | ||
| Pog ⊥ NB (mm) | 0.38 | NS |
| ai.ii–NB (°) | 1.64 | NS |
| ii ⊥ NB (mm) | 0.38 | NS |
| ii ⊥ APog (mm) | 0.31 | NS |
| ii ⊥ GoMe (mm) | 0.38 | NS |
| ms ⊥ GoMe (mm) | 0.69 | NS |
| OB (mm) | 0.32 | 0.01 |
| OJ (mm) | 0.27 | NS |
| ai.ii–GoMe (°) | 1.71 | NS |
SE, error of method; P , probability of means of first and second measurement to be different assessed by Exact Wilcoxon signed rank test; NS, not significant.
Estimation of heritability
The AIC values for each model were calculated and the most parsimonious models with the lowest values were chosen. Only the results of the best-fitting model have been taken into account. Variables with best fitting-model and contribution of factors ( a2 , c2 , d2 , e2 ) were counted. The results of model-fitting analyses are summarized in Tables 4 and 5 .
AIC values of all the models.
| Variable | ACE | ADE | AE | CE | DE | E |
|---|---|---|---|---|---|---|
| SNA (°) | −0.10 | −0.10 | −2 . 10 | 10.34 | −1.04 | 87.24 |
| SNB (°) | −6.78 | −5.17 | −7 . 17 | 0.81 | −2.36 | 98.61 |
| SNPog (°) | −6 . 27 | −3.72 | −5.72 | −0.82 | −0.03 | 97.55 |
| NSBa (°) | −3.96 | −3.96 | −5 . 96 | 12.94 | −3.97 | 91.48 |
| NSAr (°) | −1.72 | −2.05 | −3 . 72 | 13.26 | −3.64 | 80.94 |
| NAPog (°) | −4.37 | −4.23 | −6 . 23 | 10.38 | −2.73 | 87.50 |
| SN–GoMe (°) | −10 . 91 | −7.51 | −9.51 | −7.55 | −2.83 | 83.45 |
| ANSPNS–GoMe (°) | −6 . 14 | −3.23 | −5.23 | −1.75 | 0.73 | 94.60 |
| SN–ArRp (°) | −6.60 | −6.70 | −8 . 60 | 9.45 | −7.60 | 79.26 |
| PoOr–GoMe (°) | −9 . 16 | −5.19 | −7.19 | −6.05 | −0.16 | 89.22 |
| NGnGo (°) | −9.38 | −8.81 | −10 . 81 | 2.83 | −6.32 | 87.04 |
| DcXiPm (°) | −8.87 | −8.45 | −10 . 45 | −1.09 | −6.59 | 65.49 |
| ArRp–MB1Me (°) | −9.68 | −10.36 | −11.68 | 16.13 | −11 . 89 | 88.65 |
| CoGoMe (°) | −10.08 | −9.55 | −11 . 55 | −3.66 | −7.95 | 66.25 |
| ArGoMe (°) | −10.73 | −10.83 | −12 . 73 | 6.86 | −11.53 | 77.10 |
| ai.ii–NB (°) | −3.40 | −3.41 | −5 . 40 | 5.29 | −4.04 | 58.48 |
| ai.ii–GoMe (°) | −4.11 | −3.37 | −5 . 37 | 1.30 | −0.97 | 63.32 |
| CoA (mm) | −8 . 09 | −2.24 | −4.24 | 9.05 | 5.78 | 157.25 |
| CoGo (mm) | −8 . 56 | −1.21 | −3.21 | −6.51 | 7.21 | 95.97 |
| CoPog (mm) | −7 . 06 | 11.59 | 9.59 | −1.80 | 24.23 | 185.25 |
| CoB (mm) | −8 . 40 | 11.18 | 9.18 | −3.79 | 23.99 | 185.22 |
| ArB (mm) | −11 . 16 | 7.07 | 5.07 | −0.57 | 19.94 | 201.11 |
| ArA (mm) | −6 . 15 | 1.16 | −0.84 | 12.71 | 10.28 | 172.45 |
| Pog ⊥ NB (mm) | 2.97 | 3.69 | 1 . 69 | 19.03 | 5.88 | 126.10 |
| GoGn (mm) | −9 . 49 | 0.74 | −1.26 | 4.07 | 10.57 | 174.38 |
| GoPog (mm) | −8 . 75 | 3.50 | 1.50 | 1.82 | 14.30 | 173.61 |
| XiPm (mm) | −10 . 28 | 4.79 | 2.79 | 5.98 | 16.93 | 204.94 |
| R1R2 (mm) | −1 . 15 | 2.92 | 0.92 | 2.49 | 8.39 | 98.49 |
| NMe (mm) | −9 . 74 | 7.47 | 5.47 | 1.12 | 19.74 | 200.72 |
| NANS (mm) | −8.25 | 4.89 | 2.89 | −9 . 43 | 13.28 | 115.68 |
| ANSMe (mm) | −10 . 13 | −0.15 | −2.15 | 4.92 | 9.94 | 174.85 |
| SGo (mm) | −10 . 18 | 1.36 | −0.64 | −7.30 | 11.92 | 127.21 |
| ii ⊥ NB (mm) | −0.17 | 0.02 | −1 . 98 | 21.84 | 1.44 | 124.20 |
| ii ⊥ APog (mm) | −4.75 | −5.89 | −6.75 | 33.81 | −7 . 60 | 117.77 |
| ii ⊥ GoMe (mm) | −9 . 45 | −2.58 | −4.58 | 19.15 | 7.44 | 184.65 |
| ms ⊥ GoMe (mm) | −7.84 | −0.02 | −2.02 | −8 . 22 | 7.82 | 80.30 |
| OB (mm) | −1.24 | −3.39 | −3.24 | 18.46 | −5 . 36 | 56.78 |
| OJ (mm) | −6.33 | −3.94 | −5.94 | −7 . 88 | −1.93 | 31.03 |
| MB2 ⊥ MB1Me (mm) | −3.53 | −3.16 | −5 . 16 | 1.62 | −1.63 | 55.71 |
| PC1 | −10 . 30 | 25.29 | 23.29 | −4.03 | 41.76 | 257.01 |
| PC2 | −10.71 | −9.99 | −11 . 99 | −0.62 | −7.61 | 83.68 |
| PC3 | −7.59 | −7.28 | −9 . 28 | 3.50 | −6.08 | 88.07 |
| PC4 | −4.54 | −4.48 | −6 . 48 | 11.26 | −3.54 | 91.96 |
| PC5 | −1.65 | −1.55 | −3 . 55 | 10.78 | 0.03 | 74.23 |
| PC6 | −7.73 | −8.48 | −9.73 | 11.18 | −10 . 12 | 69.11 |
E, specific environment; CE, common and specific environment; AE, additive genes and specific environment; ACE, additive genes, common and specific environment; ADE, additive genes, dominant genetic factor, specific environment; DE, dominant genetic factor and specific environment; PC, principal component; Values in bold —best fitting model (lowest AIC value).
Path coefficients of the most parsimonious model for each variable.
| Variable | Model | Genetic | Environment | ||||||
|---|---|---|---|---|---|---|---|---|---|
| a2 | SE | d2 | SE | c2 | SE | e2 | SE | ||
| Mandibular relationship to cranial base and maxillary structures | |||||||||
| SNA (°) | AE | 0.74 | 0.04 | 0.26 | 0.04 | ||||
| SNB (°) | AE | 0.79 | 0.04 | 0.21 | 0.04 | ||||
| SNPog (°) | ACE | 0.42 | 0.18 | 0.36 | 0.17 | 0.22 | 0.04 | ||
| NSBa (°) | AE | 0.79 | 0.04 | 0.21 | 0.04 | ||||
| NSAr (°) | AE | 0.75 | 0.04 | 0.25 | 0.04 | ||||
| NAPog (°) | AE | 0.78 | 0.04 | 0.22 | 0.04 | ||||
| SN–GoMe (°) | ACE | 0.36 | 0.19 | 0.39 | 0.17 | 0.24 | 0.04 | ||
| ANSPNS–GoMe (°) | ACE | 0.39 | 0.18 | 0.38 | 0.17 | 0.23 | 0.04 | ||
| NMe (mm) | ACE | 0.24 | 0.09 | 0.68 | 0.09 | 0.09 | 0.02 | ||
| NANS (mm) | CE | 0.77 | 0.03 | 0.23 | 0.03 | ||||
| ANSMe (mm) | ACE | 0.34 | 0.12 | 0.56 | 0.12 | 0.10 | 0.02 | ||
| CoA (mm) | ACE | 0.43 | 0.14 | 0.45 | 0.14 | 0.12 | 0.02 | ||
| ArA (mm) | ACE | 0.41 | 0.13 | 0.49 | 0.13 | 0.10 | 0.02 | ||
| SN–ArRp (°) | AE | 0.76 | 0.04 | 0.24 | 0.04 | ||||
| PoOr–GoMe (°) | ACE | 0.34 | 0.18 | 0.42 | 0.17 | 0.24 | 0.04 | ||
| NGnGo (°) | AE | 0.79 | 0.04 | 0.21 | 0.04 | ||||
| SGo (mm) | ACE | 0.24 | 0.13 | 0.60 | 0.12 | 0.17 | 0.03 | ||
| Mandibular skeletal variables | |||||||||
| DcXiPm (°) | AE | 0.74 | 0.04 | 0.26 | 0.04 | ||||
| CoGoMe (°) | AE | 0.73 | 0.04 | 0.27 | 0.04 | ||||
| CoB (mm) | ACE | 0.18 | 0.09 | 0.71 | 0.09 | 0.11 | 0.02 | ||
| ArB (mm) | ACE | 0.23 | 0.09 | 0.68 | 0.09 | 0.08 | 0.02 | ||
| GoGn (mm) | ACE | 0.33 | 0.12 | 0.57 | 0.12 | 0.10 | 0.02 | ||
| XiPm (mm) | ACE | 0.28 | 0.10 | 0.64 | 0.10 | 0.08 | 0.01 | ||
| R1R2 (mm) | ACE | 0.35 | 0.18 | 0.42 | 0.17 | 0.23 | 0.04 | ||
| MB2 ⊥ MB1Me (mm) | AE | 0.68 | 0.05 | 0.32 | 0.05 | ||||
| CoPog (mm) | ACE | 0.20 | 0.09 | 0.70 | 0.09 | 0.11 | 0.02 | ||
| ArRp–MB1Me (°) | DE | 0.81 | 0.03 | 0.19 | 0.03 | ||||
| ArGoMe (°) | AE | 0.77 | 0.04 | 0.23 | 0.04 | ||||
| CoGo (mm) | ACE | 0.27 | 0.16 | 0.50 | 0.14 | 0.22 | 0.04 | ||
| GoPog (mm) | ACE | 0.29 | 0.11 | 0.60 | 0.11 | 0.11 | 0.02 | ||
| Dento-alveolar variables | |||||||||
| Pog ⊥ NB (mm) | AE | 0.83 | 0.03 | 0.17 | 0.03 | ||||
| ai.ii–NB (°) | AE | 0.69 | 0.05 | 0.31 | 0.05 | ||||
| ii ⊥ NB (mm) | AE | 0.84 | 0.03 | 0.16 | 0.03 | ||||
| ii ⊥ APog (mm) | DE | 0.85 | 0.03 | 0.15 | 0.03 | ||||
| ii ⊥ GoMe (mm) | ACE | 0.46 | 0.13 | 0.46 | 0.13 | 0.08 | 0.02 | ||
| ms ⊥ GoMe (mm) | CE | 0.69 | 0.04 | 0.31 | 0.04 | ||||
| OB (mm) | DE | 0.74 | 0.05 | 0.26 | 0.05 | ||||
| OJ (mm) | CE | 0.50 | 0.06 | 0.50 | 0.06 | ||||
| ai.ii–GoMe (°) | AE | 0.71 | 0.05 | 0.29 | 0.05 | ||||
| Principal components | |||||||||
| PC1 | ACE | 0.12 | 0.06 | 0.82 | 0.05 | 0.06 | 0.01 | ||
| PC2 | AE | 0.78 | 0.04 | 0.22 | 0.04 | ||||
| PC3 | AE | 0.77 | 0.04 | 0.23 | 0.04 | ||||
| PC4 | AE | 0.79 | 0.04 | 0.21 | 0.04 | ||||
| PC5 | AE | 0.76 | 0.04 | 0.24 | 0.04 | ||||
| PC6 | DE | 0.76 | 0.04 | 0.25 | 0.04 | ||||
a2 , additive genetic factors; d2 , dominant genetic factors; c2 , common environment factors; e2 , specific environment factors; SE, standard error.
Sagittal mandibular relationship to cranial base and maxilla
This group of variables were divided into linear and angular subgroups. Linear variables (NMe, ANSMe, CoA, ArA, and SGo) showed dependence of additive genetic factors a2 (24–43%), shared environment c2 (45–68%) and unique environment e2 (9–17%). One linear variable (NANS) showed dependency only of environment effects c2 = 77% and e2 = 23%. Angular variables (SNA, SNB, NSBa, NSAr, NAPog, SN–ArRp, and NGnGo) showed highly additive genetic determination a2 (74–79%), except four variables (SNPog, SN–GoMe, ANSPNS–GoMe, and PoOr–GoMe) which showed dependency of additive genetic and common/unique environment factors (ACE model).
Mandibular skeletal variables
The best fitting model for all linear variables was ACE, except one variable (MB2 ⊥ MB1Me) which was best explained by an AE model. Angular variables showed high genetic determination: AE model for DcXiPm, CoGoMe, ArGoMe a2 (73–77%) and DE model for ArRp–MB1Me ( d2 = 81%).
Mandibular dento-alveolar variables
Both angular variables (ai.ii–NB, ai.ii–GoMe) were determined by AE model ( a2 = 69% and a2 = 71%, respectively). Linear variables belonged to variety of models: AE was the best-fitting model for Pog ⊥ NB, ii ⊥ NB variables and showed high additive genetic determination a2 (83% and 84%), DE model for ii ⊥ APog and OB d 2 (85% and 74%), CE for ms ⊥ GoMe and OJ variables and ACE was the best-fitting model for ii ⊥ GoMe.
Principal components
Six principal components were determined by principal components analysis explaining 83% of total variance ( Table 6 ). First component PC1 consisted of all linear variables except Pog ⊥ NB, ii ⊥ NB, ii ⊥ APog, OB, OJ, MB2 ⊥ MB1Me and the best-fitting model was ACE. All angular and three linear variables (Pog ⊥ NB, ii ⊥ NB, and ii ⊥ APog) were determined to PC2, PC3, PC4, and PC5 groups. These components show high additive genetic determination a2 (76–79%) with best-fitting model AE. NaPog, OB, and OJ formed PC6 with best fitting model DE. Three variables (NAPog, SN–GoMe, and ai.ii–GoMe) were included in two different components.
Factor loadings after varimax rotation.
| Variables | PC1 | PC2 | PC3 | PC4 | PC5 | PC6 |
|---|---|---|---|---|---|---|
| SNA (°) | 0.16 | −0.06 | −0 . 76 | 0.20 | 0.36 | 0.29 |
| SNB (°) | 0.21 | −0.13 | −0 . 88 | −0.15 | 0.27 | −0.10 |
| SNPog (°) | 0.20 | −0.21 | −0 . 84 | −0.26 | 0.27 | −0.11 |
| NSBa (°) | −0.09 | 0.07 | 0.28 | 0.12 | −0 . 86 | −0.03 |
| NSAr (°) | 0.00 | −0.06 | 0.31 | 0.07 | −0 . 86 | −0.07 |
| NAPog (°) | −0.07 | 0.23 | 0.17 | 0 . 66 | 0.10 | 0 . 57 |
| SN–GoMe (°) | −0.05 | 0 . 82 | 0 . 51 | 0.16 | −0.07 | −0.03 |
| ANSPNS–GoMe (°) | 0.02 | 0 . 82 | 0.35 | 0.14 | 0.12 | −0.09 |
| SN–ArRp (°) | 0.03 | −0.19 | 0 . 84 | 0.03 | 0.04 | 0.12 |
| PoOr–GoMe (°) | 0.06 | 0 . 87 | 0.33 | 0.15 | 0.14 | −0.03 |
| NGnGo (°) | −0.11 | −0 . 88 | 0.02 | 0.03 | −0.14 | 0.15 |
| DcXiPm (°) | −0.02 | −0 . 83 | −0.02 | −0.21 | 0.01 | −0.08 |
| ArRp–MB1Me (°) | −0.07 | 0 . 91 | −0.19 | 0.13 | −0.09 | −0.12 |
| CoGoMe (°) | −0.04 | 0 . 92 | −0.10 | 0.07 | −0.10 | −0.10 |
| ArGoMe (°) | −0.08 | 0 . 91 | −0.17 | 0.08 | −0.11 | −0.14 |
| ai.ii–NB (°) | −0.05 | 0.05 | 0.07 | 0 . 91 | −0.05 | −0.08 |
| ai.ii–GoMe (°) | −0.11 | −0 . 60 | 0.08 | 0 . 70 | −0.12 | 0.01 |
| CoA (mm) | 0 . 89 | −0.04 | −0.23 | 0.09 | −0.09 | 0.25 |
| CoGo (mm) | 0 . 73 | −0.38 | −0.12 | −0.04 | 0.18 | −0.27 |
| CoPog (mm) | 0 . 94 | 0.10 | −0.18 | −0.11 | 0.07 | −0.16 |
| CoB (mm) | 0 . 94 | 0.13 | −0.22 | −0.06 | 0.04 | −0.11 |
| ArB (mm) | 0 . 92 | 0.07 | −0.29 | −0.04 | −0.06 | −0.14 |
| ArA (mm) | 0 . 88 | −0.12 | −0.23 | 0.12 | −0.16 | 0.22 |
| Pog ⊥ NB (mm) | 0.12 | −0.39 | 0.09 | −0 . 57 | 0.12 | −0.10 |
| GoGn (mm) | 0.87 | −0.04 | −0.06 | −0.25 | 0.00 | 0.02 |
| GoPog (mm) | 0 . 88 | −0.07 | −0.09 | −0.23 | −0.04 | 0.03 |
| XiPm (mm) | 0 . 90 | 0.06 | −0.24 | −0.20 | 0.04 | −0.11 |
| R1R2 (mm) | 0 . 66 | −0.27 | 0.02 | 0.03 | −0.25 | 0.23 |
| NMe (mm) | 0 . 84 | 0.27 | 0.36 | 0.05 | 0.19 | −0.16 |
| NANS (mm) | 0 . 72 | 0.04 | 0.31 | −0.07 | 0.06 | 0.09 |
| ANSMe (mm) | 0 . 73 | 0.36 | 0.32 | 0.17 | 0.23 | −0.21 |
| SGo (mm) | 0 . 77 | −0.39 | −0.07 | −0.04 | 0.31 | −0.21 |
| ii ⊥ NB (mm) | 0.06 | 0.31 | 0.14 | 0 . 88 | 0.04 | −0.09 |
| ii ⊥ APog (mm) | 0.05 | 0.35 | −0.01 | 0 . 71 | −0.07 | −0.46 |
| ii ⊥ GoMe (mm) | 0 . 81 | 0.23 | 0.19 | 0.31 | 0.22 | −0.08 |
| ms ⊥ GoMe (mm) | 0 . 76 | −0.20 | 0.23 | 0.31 | 0.21 | −0.18 |
| OB (mm) | −0.01 | −0.31 | −0.06 | −0.17 | −0.02 | 0 . 74 |
| OJ (mm) | −0.13 | −0.10 | 0.10 | −0.01 | 0.08 | 0 . 72 |
| MB2 ⊥ MB1Me (mm) | 0.34 | 0.06 | 0.18 | 0.13 | 0.30 | 0.07 |
Values in bold: factor loadings greater than 0.50 are significant.
Discussion
The reproducibility of the measurements was good except for the Xi-Pm and OB measurements. These 2 of 39 variables showed small, but significant differences between the first and second measurement. The inaccuracy of determining the anatomical landmarks for some variables is a well-known problem in the clinical cephalometrics. It is difficult and often nearly impossible to distinguish between left–right sides and it complicates landmark definitions due to over-projecting structures in lateral head radiograms. This problem is especially true for the deepest point of the mandible and maxilla concavity ( 19 ).
Heritability assessment is usually a first step in genetic studies, because it provides an estimate of how much phenotypic variation is attributable to genetic influence ( 12 ). Model-fitting is a method used to calculate the proportion of the total variance explained by additive/dominant genes and common/specific environment ( 4 , 13 , 20 ). The studies of craniofacial growth from 4 to 20 years demonstrated increasing heritability estimates of cephalometric variables with the age ( 21 ). Therefore, comparison of hereditary characteristics is more valid in the post-adolescent period when the growth is completed, as it is the case in our study. It is well known that skeletal facial maturity develops in females between 12 and 14 years and 2 years of age later for males. Nevertheless, the chronological age is not a reliable and accurate maturity indicator. Therefore, in this study, cervical maturation method was used to select a sample with completed facial skeletal growth. Although there is study reporting lifelong mandibular size/shape changes, but the remaining skeletal growth of the mandible 2 years after the pre-adoslescent growth spurt completion is negligible from the clinical and theoretical stand-point and therefore, individuals with cervical maturation stage 6 were considered as adults ( 22 ).
Our attempt to summarize and compare own results with the previous twin studies of genetic influence on mandible morphology and its position in the craniofacial skeleton is presented in the Table 7 .
Comparison of the heritability estimates of cephalometric variables of twin studies.
| Study authors | Sample size (number of twin pairs) | Sample age range (years) | Face height | Mandibular relationship to cranial base and maxillary structures | Mandibular skeletal variables | ||||||||
|---|---|---|---|---|---|---|---|---|---|---|---|---|---|
| UAFH | LAFH | TAFH | TPFH | Saddle angle | SNB | SN–MP | PP–MP | Gonial angle | Mandibular body length | Ramus height | |||
| Model fitting analysis | Best fitting model and a2 (or d2 ) values | ||||||||||||
| Sidlauskas et al. (current study) | 90MZ | 15.3–39.6 | CE | ACE | ACE | ACE | AE | AE | ACE | ACE | AE | ACE | ACE |
| 51DZ | — | 0.34 | 0.24 | 0.24 | 0.79 | 0.79 | 0.36 | 0.39 | 0.77 | 0.33 | 0.27 | ||
| Carels et al . (13) | 33MZ | 9.0–16.0 | AE | — | AE | AE | CE | CE | — | — | AE | DE | AE |
| 46DZ | 0.675 | f = 0.685, m = 0.912 | 0.735 | — | — | 0.453 | 0.791* | 0.682 | |||||
| Savoye et al . (20) | 33MZ | 9.0–16.0 | UAFH/LAFH | ||||||||||
| 46DZ | AE 0.71 | ||||||||||||
| Classical correlation analysis | Heritability estimates h2 | ||||||||||||
| Amini and Borzabadi- Farahani (12) | 25MZ | 13.4–20.1 | 0.18 | 1.08 | 1.08 | 0.18 | 1.00 | 0.98 | 1.22 | 1.22 | 1.62 | 0.26 | 0.50 |
| 25DZ | |||||||||||||
| Manfredi et al . (9) | 10MZ | 10.0–13.0 | −0.36 | 1.56 | 1.5 | 0.32 | 0.04 | — | — | 2.23 | 1.16 | — | 0.52 |
| 10DZ | |||||||||||||
| Lundström and McWilliam (5) | 28MZ | 13.0–20.0 | 0.16 | 0.86 | 0.86 | 0.26 | — | — | — | — | — | — | — |
| 27DZ | |||||||||||||
| Lobb (8) | 30MZ | 12.0–21.0 | UAFH/LAFH | — | — | 0.66 | 0.21 | — | 0.36 | 0.41 | — | — | |
| 30DZ | 0.52 | ||||||||||||
| Nakata et al . (23) | 67MZ | Average 12.2 | 0.63 | — | 0.77 | 0.59 | 0.51 | — | 0.59 | — | 0.57 | 0.61 | 0.27 |
| 29DZ | |||||||||||||
| Variance analysis | F -ratios | ||||||||||||
| Dudas and Sassouni (24) | 12MZ | Early:4.4–13.2 | 5.62** | 4.71** | 6.41** | — | — | — | 2.71 | — | 1.99 | 4.26** | 2.63 |
| 10DZ | Late:13.1–21.8 | 2.55 | 3.92** | 5.17** | 2.80 | 2.39 | 0.80 | 0.87 | |||||
| Sreedevi et al . (25) | 12MZ | 14.0–25.0 | 2.76 | 13.81*** | 9.06*** | 4.43** | 2.70 | — | 1.59 | 3.60** | 1.99 | 2.91 | 0.96 |
| 7DZ | |||||||||||||
TAFH, total anterior face height; UAFH, upper anterior face height; LAFH, lower anterior face height; TPFH, total posterior face height; MP, mandibular plane; PP, palatal plane; f, female; m, male; *, d2 ; For F -ratios: significance < 0.05. **significant at 5% level; ***significant at 1% level.
Sagittal position of the mandible in the craniofacial complex depends on many determinants, the most important being: position of mandibular fossa, cranial base length and growth pattern. Sagittal localization of mandibular fossa is determined by morphology of cranial base and can be described by saddle angle (NSBa). We found its high genetic determination ( a2 = 79%) but results of the previous reports are contradictory. Studies with the twin age over 16 years found high genetic influence, whereas younger twins demonstrated low or no heritability estimate for the saddle angle ( 9 , 12 , 13 , 25 ). As demonstrated in the study of heritability between parents and their offspring, heritability of saddle angle increases with age: our data support this statement ( 26 ). Other angular measurements representing sagittal position of the mandible to cranial base (SN–ArRp, SNB) also were found to be under strong genetic influence a2 = 76% and 79%, respectively. Considering genetic control of SNB angle our results are consistent with the results of the latest studies ( 12 ).
Linear variables representing vertical and horizontal mandibular position to cranial base and maxilla (ANSMe, NMe, SGo, CoA, and ArA), and angles describing vertical relationship of mandible (SN–GoMe, PoOr–GoMe, and ANSPNS–GoMe) to upwards-located skeletal structures demonstrated low to moderate genetic influence and were determined by the ACE model, except NANS, which shows strong environment determination (CE model). We also noticed some differences for heritability estimates between horizontal and vertical linear measurements describing positions of the mandible in relation to the cranial base. We found that horizontal linear variables are more determined by genetic factors, than vertical variables. This is in contrast to the results of some previous studies reporting higher heritability estimates for many vertical linear measurements compared with horizontal ones ( 5 , 13 , 20 , 27 ). This may be due to methodological differences (we used actual lengths, while many other studies used projected lengths) and different study sample maturation ( 5 , 13 , 20 ). The projected lengths may not reflect the actual ratio between horizontal and vertical measurements. The results of our study indicate that genetic control is more attributable to mandible sagittal than vertical position. The anterior face height (TAFH, LAFH) demonstrated higher genetic determination compared with posterior face height (TPFH).
The most important characteristics of mandible skeletal morphology are gonial angle, mandibular body length, and ramus width. The present study showed high heritability values for the gonial angle (ArGoMe, a2 = 77%) and mandibular arc angle (DcXiPm, a2 = 74%). For the linear measurements such as mandibular body length (GoPog, GoGn), ramus width (R1R2), and ramus height (CoGo) the best-fitting model was ACE, indicating low genetic determination. The gonial angle and mandibular arc angle are under stronger genetic control compare to the mandibular length or ramus height at the time close to pubertal growth spurt, while strong genetic determination of mandibular body length was more dominant in the younger study sample ( 12 , 13 , 23 ). As demonstrated by Dudas and Sassouni ( 24 ), there is increasing influence of the environment on linear distances during facial growth with age.
The results of our study showed that alveolar height depends more on the environmental, than on genetic influence. This is in agreement with previous studies demonstrating that heritability estimates for dentoalveolar traits were considerably lower than skeletal variables ( 28–30 ). It is known from clinical research, that environmental factors like lips, tongue and cheeks, oral muscles, and certain functions (breathing and mastication) or even body posture play an important part in the development of occlusion ( 31–34 ). Our results support these clinical observations related to dentoalveolar height. However, variables describing sagittal position of lower incisors and chin protrusion (ai-ii–NB, ii ⊥ NB, ii ⊥ APog, and Pog ⊥ NB) showed very high heritability. This indicates an existence of an integrated balance between morphologic units in the dentofacial complex which are under strong genetic control, and units that may accommodate more to environmental factors for final establishment of the variety of occlusion ( 12 ).
It is worth to notice, that results of twin studies are difficult to compare and inconsistence or similarity should be interpreted with caution, because of the differences in zygosity determination, sample size, maturity stage, and statistical methods used. The modern model-fitting methods that allow the goodness-of-fit of various genetic and environmental models to be tested statistically are not comparable with path analysis and Dahlberg quotient used in the 1980s. Only a few studies used model fitting analysis for cephalometric twin studies ( 13 , 20 , 23 ). Principal components analysis showed six components explaining 83% of variance in our study. Whereas Carels et al . ( 13 ) found five independent factors explaining 81% of variance in a similar study. However, Nakata et al . ( 23 ) found at least nine independent significant components. All the differences of results among the studies are potentialy driven by usage of different criterion (i.e. eigenvalue) for determining the number of factors. The detailed comparison of the results using model fitting analysis presented in the Table 7 .
Concerning the clinical relevance of our results it could be concluded that form of the mandible determined by the gonial and mandibular arc angles seems to be more under genetic control than its length, therefore orthodontic and/or orthopedic treatment procedures are expected to act more on mandibular size then form modification. However, it should be remembered that heritability is a population concept and is irrelevant to the individual. It would be misleading to suggest that structures with low heritability and highly influenced by the environment are always more amenable to prevention or treatment at the individual level. Therefore, using the present findings it is difficult to predict success of orthodontic treatment procedures with high degree of certainty for every clinical case.
A specific area on the lateral view of the face delimitated by the angles with high heritability estimates (SNB, a2 = 79%; NSAr, a2 = 75%; ArGoMe, a2 = 77%) attracted our attention ( Figure 2 ). By analogy with ‘triangle of face-similarity’ formed by Na, Go, and Gn points, we propose to name this strongly genetically determined area as ‘polygon of the facial profile similarity’ ( 9 ). This area presumably could be responsible for inherited facial profile similarity between twins.
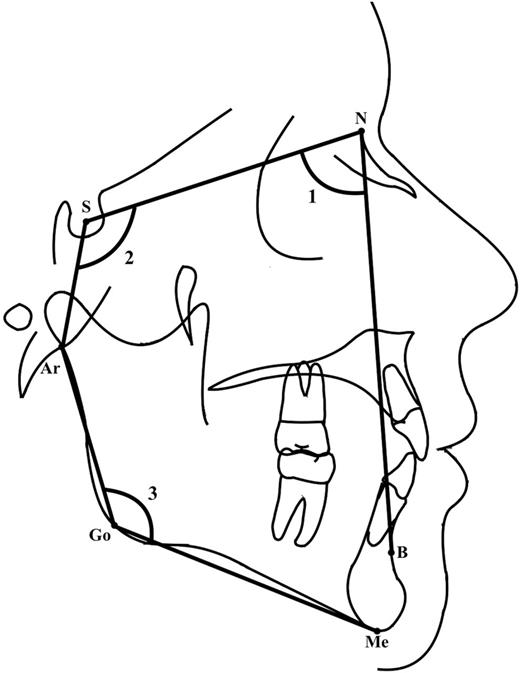
‘Polygon of the facial profile similarity’—the craniofacial area determined by angles with high heritability estimates: 1, SNB; 2, NSAr; 3, ArGoMe.
Conclusions
The shape and sagittal position of the mandible is under stronger genetic control than is its size and vertical relationship to the cranial base.
Polygon of the ‘face-similarity’ is under strong genetic control and may explain facial profile resemblance between twins.
Funding
This work was supported by the Lithuanian University of Health Sciences Research Foundation.
Acknowledgements
We wish to express our sincere thanks to the twins and their families who agreed to participate in the study. All authors contributed equally to the accomplishment of the manuscript.
References

