


Abstract
The aim of this study was to compare the electrochemical corrosion behaviour of stainless steel (SS) and nickel–titanium (Ni-Ti) orthodontic archwires in Ringer’s solution at temperatures ranging from 15 to 55°C by using linear sweep voltametry and electrochemical impedance spectroscopy. Polarization curves show that the corrosion current density of SS is greater than that of Ni-Ti alloy. Since the corrosion current density is directly proportional to the corrosion rate, a great corrosion current density shows a lower resistance against corrosion. Therefore, in comparison with SS, Ni-Ti alloys have a lower corrosion rate. Results show that the temperature of the solution affects the corrosion rates of the alloys. As the temperature increases, the corrosion resistance of both of the alloys decreases, although these variations were not so large. Impedance measurements show that the electrochemical behaviour of Ni-Ti exhibits higher polarization resistance and lower capacitance, which means that passive film formed on this alloy is more homogeneous and thicker in comparison with SS. Results also show that polarization resistance of both alloys decreases slowly with increases in the temperature of the solution.
Introduction
Orthodontic mechanotherapy encompasses the use of several archwires during specific stages of treatment. Metallic orthodontic appliances consist of bands, arch wires, ligature wires, hooks, tubes, brackets, and springs are daily used in orthodontic practices for the correction of malocclusions in patients (Oh et al., 2004; Verstrynge et al., 2006; Sabane et al., 2009). One of the most important issues in the use of metallic biomaterials is their corrosion behaviour. The corrosion of orthodontic appliances in the oral environment may release corrosion products or effects on the physical properties and the clinical performance of orthodontic appliances (House et al., 2008; Virtanen et al., 2008).
Orthodontic appliances and retainers are commonly constructed from stainless steel (SS), cobalt–chromium alloy, nickel–titanium (Ni-Ti) ,and titanium alloys, used singly or in combination. Up until the 1930s, the only orthodontic wires available were made of gold alloy. Austenitic SS, with its greater strength, higher modulus of elasticity, excellent formability, resistance to corrosion, and moderate costs, was introduced as an orthodontic wire in 1929 (Wilkinson 1962; Vaheda et al., 2007). The SS alloys used as orthodontic wires are of the ‘18-8’ austenitic type and are classified as AISI type 304. This alloy owes its corrosion resistance property to chromium, a highly reactive base metal. The corrosion resistance of alloy depends on the passive film, which spontaneously forms and reforms in air and under most fluid conditions.
Ni-Ti shape memory alloy wires were introduced in orthodontics clinics in 1972 by Andreasen with particular properties of superelasticity and shape memory effect (Merritt and Brown, 1995; Li et al., 2006; Daems et al., 2009). All the authors agree that the titanium corrosion resistance in these media is due to the formation of an adherent and highly protective oxide film on its surface which is mainly formed of TiO2 (Wilkinson 1962; Daems et al., 2009; Kadowaki et al., 2009; Kao and Huang, 2010). In the oral environment, orthodontic attachments are exposed to a number of potentially damaging physical and chemical agents. Corrosion resistance of orthodontic alloys depends on the oral environment, which is influenced by several variables, such as temperature, quantity and quality of saliva, plaque, pH, proteins, and physical/chemical properties of solids/liquids food (Rondelli and Vicentini, 2000; Huang, 2003). Temperature can affect the corrosion behaviour of materials in different ways. The body temperature of 37°C can accelerate electrochemical reactions and even change the mechanism of corrosion from that occurring at room temperature (Virtanen et al., 2008). Orthodontic wires are subject to larger temperature variations than most other parts, coping with ice-cold temperatures through to hot coffee (Maijer and Smith, 1982; Maijer and Smith, 1986; Fraker 1987; Powers and Wataha, 2008).
To date, few studies have investigated the effect of temperature on the corrosion behaviour of Ni-Ti and SS alloys in artificial saliva. But it has been proven by many authors that temperature variations can affect corrosion resistances of these alloys (Fraker, 1987; Guyton and Hall, 1996; Trépanier and Pelton, 2004; Powers and Wataha, 2008). The aim of this work was, therefore, to compare the effect of temperature variations (15–55°C) on the corrosion behaviour of Ni-Ti and SS archwires in Ringer’s solution by using electrochemical techniques. To evaluate temperature effects on the alloys, samples were tested in Ringer’s solution at 15, 25, 35, 37, 40, 42, 45, and 55°C.
Materials and methods
Test materials
Nickel–titanium (Orthotechnology Co. Ltd, Tampa, Florida) and SS (G&H Wire Company, Greenwood, India) as-received archwires were used as working electrode in this research. For electrochemical measurements, a series of Ni-Ti and SS wires were coated at both ends using a non-conductive cold resin mounted as working electrode, in order to obtain active area of 1.414 and 0.3195 cm2 exposed to the solution for Ni-Ti and SS archwires, respectively. All samples were checked to ensure good electrical conductivity. Prior to the experiments, the precise diameter and expose length of each wire were measured, in order to obtain the actual area of the working electrode. All specimens were polished up to #1000 and #2000 with silicon carbide paper and then cleaned with deionized water, degreased with acetone, and immersed in Ringer’s solution at room temperature for 24 hours before each electrochemical measurement.
Test solution
The experiments were carried out using Ringer’s solution (Kamachi Mudali et al., 2003; Berradja et al., 2006; Singh and Dahotre, 2007). The composition of this solution has been shown in Table 1. A custom-made cell was employed to maintain the temperature of the solution at the desired value. The accuracy of temperature maintained in the present investigation was ±0.5°C.
Composition of Ringer’s solution (in 100 ml water).
| Compound | Composition (g) |
| Sodium chloride | 0.86 |
| Calcium chloride | 0.03 |
| Potassium chloride | 0.033 |
| Compound | Composition (g) |
| Sodium chloride | 0.86 |
| Calcium chloride | 0.03 |
| Potassium chloride | 0.033 |
Composition of Ringer’s solution (in 100 ml water).
| Compound | Composition (g) |
| Sodium chloride | 0.86 |
| Calcium chloride | 0.03 |
| Potassium chloride | 0.033 |
| Compound | Composition (g) |
| Sodium chloride | 0.86 |
| Calcium chloride | 0.03 |
| Potassium chloride | 0.033 |
Electrochemical measurements
The electrochemical measurements were taken by using potentiostat (Autolab model 302N; Echo chimi, Utrecht, The Netherlands). A conventional three-electrode set-up consisted of SS and Ni-Ti samples as working electrode, a platinum electrode as counter electrode, and an Ag/AgCl (3M KCl) as reference electrode was used for the experiments. All the potentials reported here are referenced to the Ag/AgCl electrode. The entire three-electrode assembly was placed in a Faraday cage to limit the noise disturbance.
The anodic and cathodic polarization plots were recorded by initiating the potential from ±300 mV relative to the open circuit potential. Scan rate was 2 mV second−1. The corrosion potential (Ecorr) as well as the corrosion current density (icorr) were extracted from the Tafel plots by GPES Autolab software through Tafel slope extrapolation. To record impedance plots, the above potentiostat was used in association with FRA Autolab software. Impedance measurements were made using a sinusoidal signal of 0.1 V amplitude and frequencies in the 10 kHz–1 mHz range. The impedance data were fitted to the equivalent circuit of Randle’s (Lo´pez et al., 2008; Valero Vidal and Igual Muñoz, 2008) to determine Rp and C values. In order to test the reproducibility of the results, the experiments were performed in triplicate.
Results
Potentiostatic tests
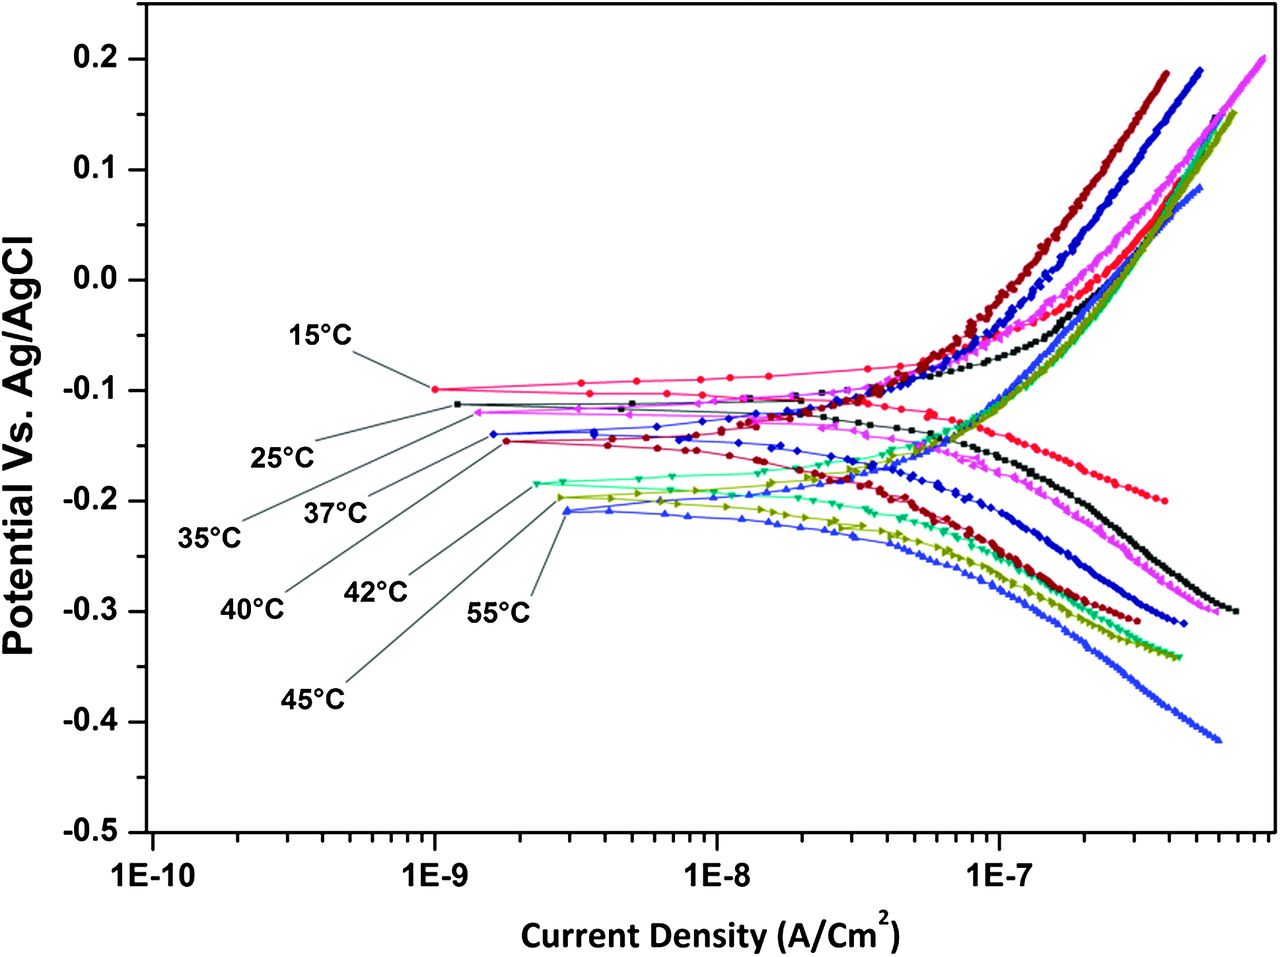
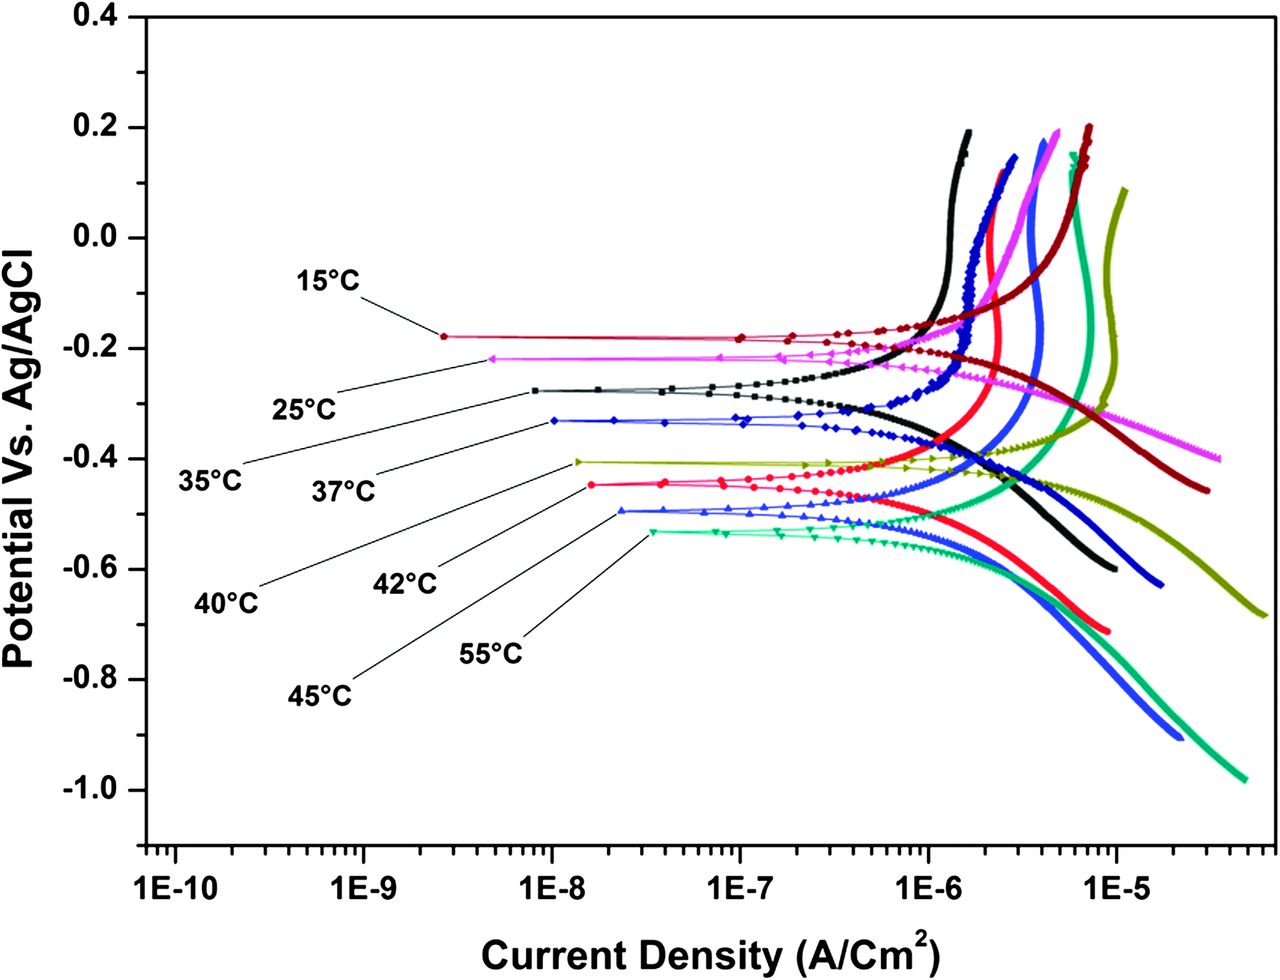
Table 2 presents ‘corrosion parameters’ obtained for SS and Ni-Ti archwires in Ringer’s solution at different temperatures. The resulting plots have been shown in Figures 1 and 2. Table 2 shows that the corrosion potential of SS is much more negative than that of Ni-Ti alloy. In addition, the corrosion current densities of SS archwires are much larger than Ni-Ti alloys. Since the corrosion current density is directly proportional to the corrosion rate, the lower the corrosion current density, the better resistance against corrosion is (Songür et al., 2009). Of course, the corrosion current density, as a function of temperature, appears to increase slowly in both of the alloys (Figures 1 and 2). Table 2 also shows that with increase in the temperature, corrosion potential of SS and Ni-Ti alloy becomes more negative, and corrosion current density becomes larger. However, at all temperatures, SS alloys have corrosion potential more negative than Ni-Ti alloys. As the temperature increases, a shift in the polarization curve towards lower potential can be seen for both of alloys.
Corrosion parameters obtained from Tafel plots of stainless steel and Ni-Ti alloys in Ringer’s solution at different temperatures.
| Temperature (°C) | Stainless steel | Ni-Ti | ||
| Ecorr (V) | icorr (A.cm−2) | Ecorr (V) | icorr (A.cm−2) | |
| 15 | −0.178 | 2.138×10⁻⁶ | −0.099 | 1.843×10⁻⁸ |
| 25 | −0.219 | 2.240×10⁻⁶ | −0.113 | 2.173×10⁻⁸ |
| 35 | −0.272 | 2.403×10⁻⁶ | −0.119 | 2.361×10⁻⁸ |
| 37 | −0.330 | 2.478×10⁻⁶ | −0.139 | 2.455×10⁻⁸ |
| 40 | −0.405 | 2.986×10⁻⁶ | −0.145 | 2.623×10⁻⁸ |
| 42 | −0.447 | 3.041×10⁻⁶ | −0.183 | 2.8016×10⁻⁸ |
| 45 | −0.496 | 3.837×10⁻⁶ | −0.196 | 2.961×10⁻⁸ |
| 55 | −0.531 | 4.356×10⁻⁶ | −0.207 | 3.145×10⁻⁸ |
Representative potentiostatic curves of stainless steel alloys in Ringer’s solution at different temperatures.
Representative potentiostatic curves of Ni-Ti alloys in Ringer’s solution at different temperatures.
Electrochemical impedance spectroscopy
Electrochemical impedance spectroscopy (EIS) is a powerful technique to study the electrochemical corrosion process on metals. The response of a corroding specimen to an applied small amplitude signal will depend on the frequency of the signal. The magnitude and phase shift at each frequency noted, and the corrosion cell response expressed as a combination of resistive, capacitive, and inductive components (Gurappa, 2002).
There are two principal impedance plot types to represent the experimental data obtained over a range of frequency for an electrochemical system: Nyquist plots of Z″(ω) as a function of Z′(ω), where ω = 2πf and Bode plots of impedance modulus as a function of frequency. Both of these can show the true behaviour of a real electrochemical system. From this method, Nyquist plots and Bode plots were obtained and fitted with an appropriate equivalent circuit to determine the solution resistance (Rs), polarization resistance (Rp), and a double layer capacitance (CDL). Among these parameters, Rp is the factor that determines corrosion resistance of alloys. This value is inversely proportional to icorr, and hence, high values of Rp correspond to low values of corrosion rates. The Nyquist plot shows semicircle and has a range from high frequencies to low frequencies. At high frequencies, the impedance is almost created by the solution resistance Rs, while at low frequencies, it is approximated by sum of Rs and polarization resistance Rp. Because of this behaviour, measurements taken at high frequencies will generally reveal the solution resistance, while measurements taken at low frequencies will measure both solution and charge transfer or polarization resistance. Thus, the difference between low and high frequencies gives the polarization resistance, which is inversely proportional to the corrosion rate (Gurappa, 2002).
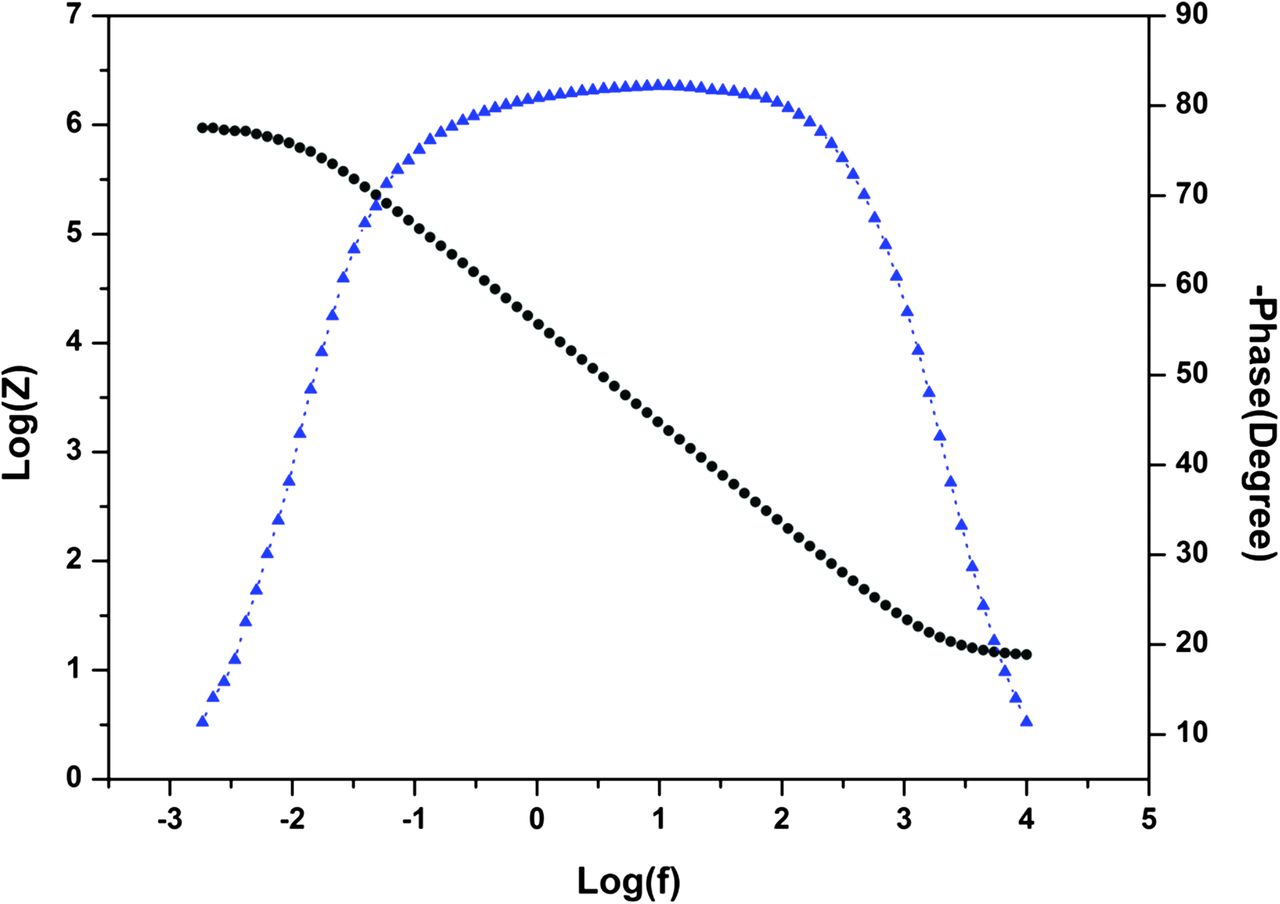
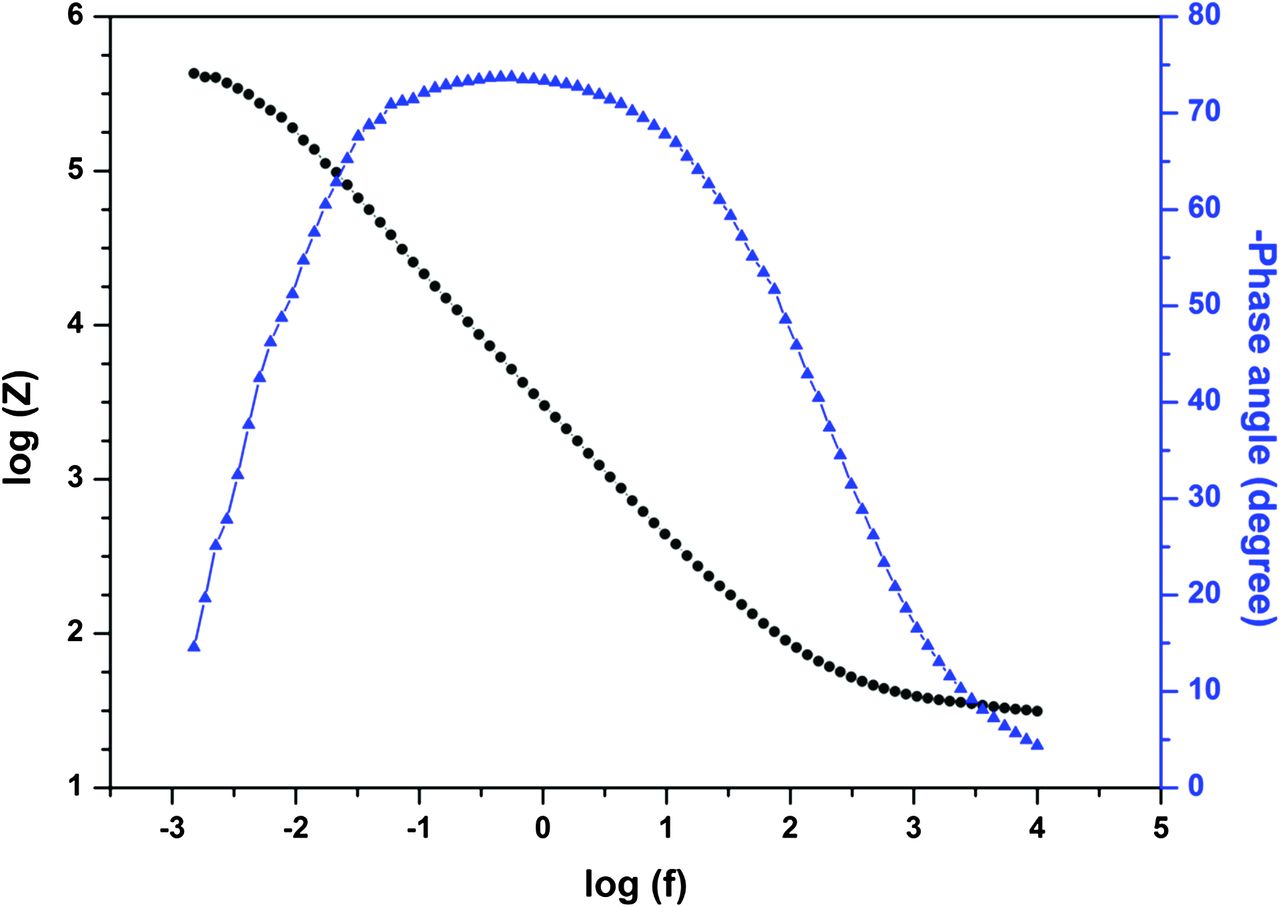
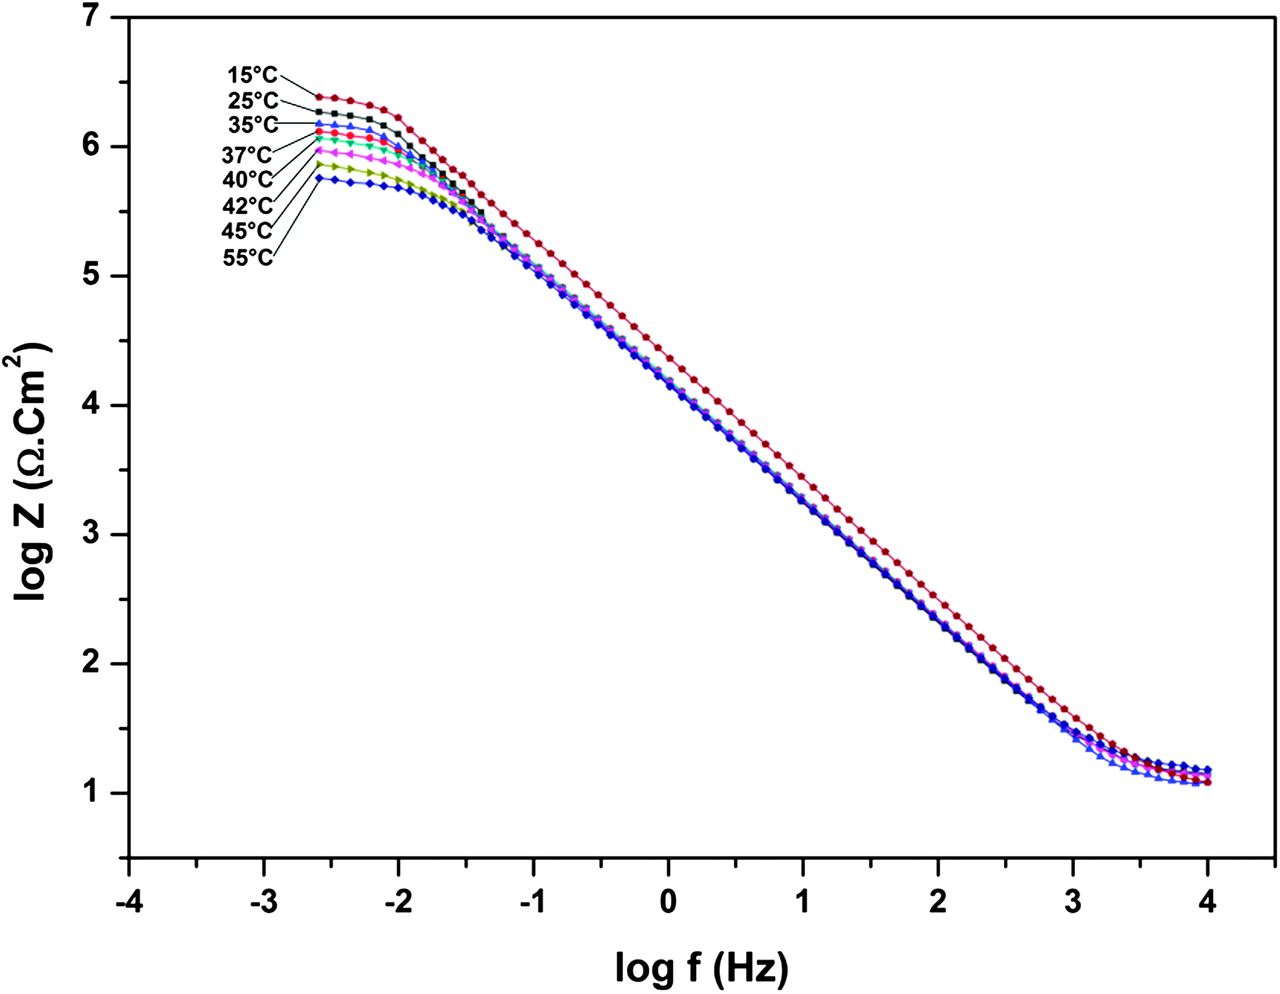
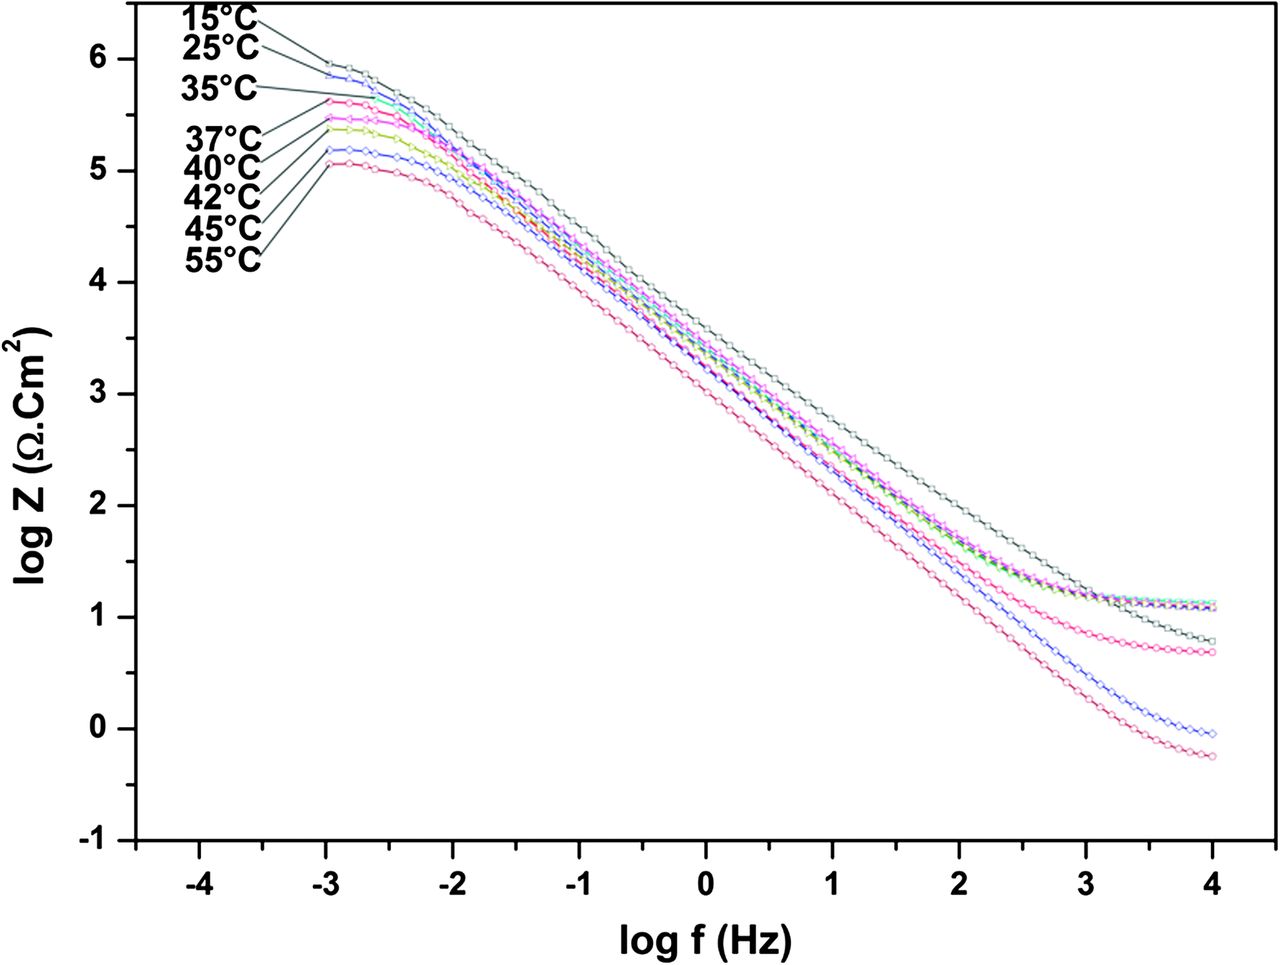
Figures 3 and 4 show the Bode (modulus) diagrams of SS and Ni-Ti alloys in Ringer’s solution at different temperatures, respectively. Table 3 summarizes the resistance, capacitance, and n values of the passive layer, obtained by adjusting the experimental data using the equivalent circuit for Ni-Ti and SS alloys at different temperatures. Figures 5 and 6 show the Bode (modulus and phase) diagrams of SS and Ni-Ti alloys in Ringer’s solution at different temperatures, respectively.
Circuit parameters for stainless steel and Ni-Ti alloys in Ringer’s solution at different temperatures.
| Temperature (°C) | Stainless steel | Ni-Ti | ||||||
| RS (Ω.cm−2) | Rp (Ω.cm−2) | n | C (F.cm−2) | Rs (Ω.cm−2) | Rp (Ω.cm−2) | n | C (F.cm−2) | |
| 15 | 12.28 (3.47) | 1.2838×10⁶ (1.687) | 0.9016 (0.98) | 1.07×10⁻⁴ | 13.80 (2.313) | 1.780×10⁶ (1.540) | 0.9218 (0.487) | 1.454×10⁻⁵ |
| 25 | 12.11 (3.058) | 0.958×10⁶ (1.418) | 0.910 (0.413) | 1.11×10⁻⁴ | 13.50 (1.982) | 1.598×10⁶ (2.247) | 0.9188 (0.189) | 1.487×10⁻⁵ |
| 35 | 12.56 (2.507) | 0.717×10⁶ (5.955) | 0.8876 (0.396) | 1.27×10⁻⁴ | 13.90 (1.374) | 1.428×10⁶ (1.026) | 0.9171 (0.098) | 1.533×10⁻⁵ |
| 37 | 13.96 (1.227) | 0.370×10⁶ (3.77) | 0.9081 (0.223) | 9.82×10⁻⁵ | 12.82 (0.893) | 1.248×10⁶ (0.943) | 0.9223 (0.088) | 1.592×10⁻⁵ |
| 40 | 13.00 (1.405) | 0.368×10⁶ (2.979) | 0.8912 (0.232) | 9.7×10⁻⁵ | 12.02 (0.89) | 1.077×10⁶ (0.750) | 0.917 (0.139) | 1.637×10⁻⁵ |
| 42 | 12.58 (1.365) | 0.203×10⁶ (2.147) | 0.875 (0.294) | 9.3×10⁻⁵ | 11.82 (0.92) | 0.746×10⁶ (1.07) | 0.912 (0.104) | 1.646×10⁻⁵ |
| 45 | 11.33 (1.470) | 0.161×10⁶ (1.982) | 0.920 (0.934) | 8.715×10⁻⁵ | 11.33 (1.547) | 0.597×10⁶ (1.244) | 0.916 (0.188) | 1.691×10⁻⁵ |
| 55 | 11.04 (1.347) | 0.101×10⁶ (1.026) | 0.9171 (0.98) | 8.642×10⁻⁵ | 11.08 (2.887) | 0.380×10⁶ (1.087) | 0.9168 (0.570) | 1.701×10⁻⁵ |
Error percentage indicated in parenthesis.
Electrochemical impedance spectroscopy Bode diagrams for stainless steel alloys in Ringer’s solution at different temperatures.
Electrochemical impedance spectroscopy Bode diagrams for Ni-Ti alloys in Ringer’s solution at different temperatures.
Electrochemical impedance spectroscopy Bode and Bode phase diagrams for stainless steel alloys in Ringer’s solution.
Electrochemical impedance spectroscopy Bode and Bode phase diagrams for Ni-Ti alloys in Ringer’s solution.
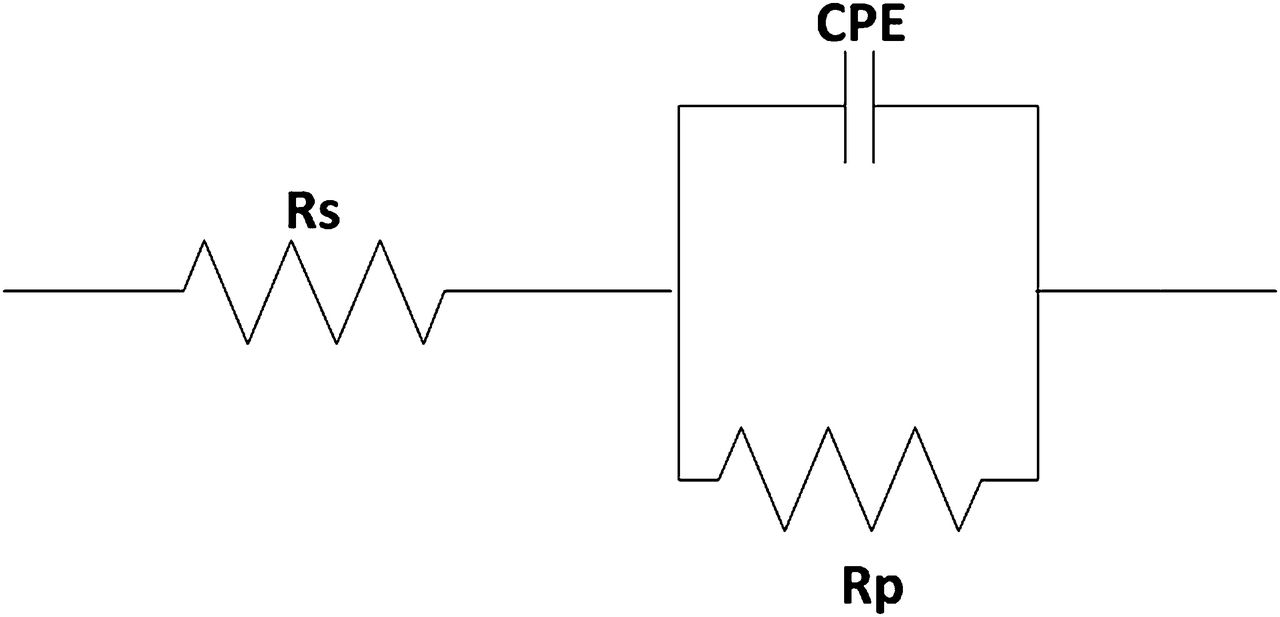
According to Bode diagrams in Figures 5 and 6, only one capacitive behaviour can be clearly identified for Ni-Ti and SS alloys in Ringer’s solution. Therefore, to compare purposes between both alloys, the Randle’s electrical equivalent circuit consisted of only one time constant (Figure 7) was used to model experimental data. Several authors have used the same electrical circuit (Lo´pez et al., 2008; Valero Vidal and Igual Muñoz, 2008). It includes a solution resistance between the working and reference electrodes (Rs), a polarization resistance at the electrode/solution interface (Rp), and CPEDL as the capacitance of the double layer represented by the constant phase element (CPE).
Equivalent circuit (Randle’s) employed to model the impedance data of stainless steel and Ni-Ti alloys.
Table 3 reveals that Ni-Ti alloys have the higher polarization resistance compare to SS alloys, indicating superior corrosion properties, and this is true at all temperatures. It can be seen that for both alloys, the highest polarization resistance (charge transfer resistance) or the lowest corrosion rate is related to 15°C (the lowest temperature). As the temperature increases, polarization resistance of both alloys decreases, so the corrosion rate increases. The lowest polarization resistance is related to 55°C.
Discussion
For all practical purposes, the metallic restoration/orthodontic wires cannot be isolated electrically from the tooth. Hence, resistance to corrosion is critically important for orthodontic wires because corrosion can lead to roughness of the surface, weakness of the appliances, and liberation of elements from the metal or alloy. Release of elements can produce discolouration of adjacent soft tissues and allergic reactions in susceptible patients (Dunlap et al., 1989; Kerosuo et al., 1995; Rahilly and Price, 2003). So, if alloys have higher corrosion resistance, the adverse effects of corrosion and liberation of elements from the alloy will be lesser.
Since corrosion resistance plays an important role in determining the use of metal alloys as biomaterials, the in vitro evaluation of such parameters is so helpful for acceptance of the new materials for that purpose. Although results obtained by in vitro experiments cannot directly be used for predictions of the alloy behaviour in the real oral conditions but are helpful for comparison purposes between different alloys. It is evident that the corrosion rates of the alloys are sensitive to temperature of the solution. If the temperature of the solution increases, the corrosion resistance will decrease due to increased diffusion of oxygen on the alloys.
The medium temperature (Ringer’s solution) increased from 15 to 25, 35, and 37°C (human body temperature) and then gets to 40, 42, 45, and 55°C, so the corrosion resistance of both alloys decreased but not significantly. The values given in Table 2 suggest that with increases in the temperature of the solution from 15 to 55°C, corrosion current densities of Ni-Ti and SS archwires increase from (1.843×10⁻⁸) and (2.138×10⁻⁶) to (3.145×10⁻⁸) and (4.356×10⁻⁶), respectively, which indicate that their corrosion resistance decreases. Therefore, even very small changes in the temperature affect the corrosion rates of the alloys, and if the variation in the temperature of the solution becomes larger, its influences on corrosion rates will become significant.
Table 2 also shows that corrosion current densities of SS are 102 times greater than corrosion current densities of Ni-Ti. Therefore, it can be concluded that corrosion rates of SS are 102 times greater than Ni-Ti alloys because, as pointed earlier, corrosion rate is directly proportional to the current density. However, because corrosion current densities are all within the same decade for each alloy, it cannot be concluded that this increase in icorr is significant in the temperature range studied, but when SS alloys compare to Ni-Ti alloys, the great differences appear.
Ni-Ti differs from SS as regard the passive layer forms on its surface. Ni-Ti, compare to SS, has high resistance against corrosion, due to the highly compact passive layers form on its surface (TiO2). This layer is more compact and protective than SS, but for both alloys, a passive layer can be formed if damaged in artificial saliva. Therefore, when the corrosion potential and corrosion currents of Ni-Ti and SS alloys are compared, it can be seen that Ni-Ti has a more positive potential and lower corrosion current. Thus, it can be concluded that Ni-Ti alloy is more resistant against corrosion than SS in Ringer’s solution and even at higher temperatures. These results are confirmed by different studies (Gurappa 2002, Singh and Dahotre 2007, Songu¨r et al., 2009) performed on SS and titanium alloys in simulated body fluids.
Figures 5 and 6 show that at high frequencies (103 to 104 Hz), the impedance data of Ni-Ti and SS alloys are almost independent of the frequency with the phase angle approaching 0 degree. This is the representative response reflecting a resistive behaviour and corresponds to the resistance of the electrolyte between the reference and working electrode (Hang et al., 2010) as noted earlier. A highly capacitive behaviour, typical of passive materials, is indicated from medium to low-frequency region (10−1 to 102 Hz) by phase angles approaching −90 degrees for Ni-Ti and −80 degrees for SS, suggesting that a highly stable film is formed on all tested alloys in the electrolyte used. At these frequencies, the impedance and the frequency have a linear relationship, which correspond to the capacitive behaviour of the electrode/electrolyte interface (Assis et al., 2006). The higher phase angles of Ni-Ti alloys indicated that the oxide layer forms on this alloy is more protective and compact than oxide layer forms on SS alloy.
Although SS has a passive oxide coating from the chromium, this layer is not as effective as that produced by titanium oxide in Ni-Ti alloys. Steel therefore has inferior corrosion resistance when compared to Ni-Ti alloys (House et al., 2008). These results are consistent with very low corrosion rates determined in polarization tests for Ni-Ti alloys (Table 2). It can also be seen in Figures 3 and 4 that at the frequencies between 104 and 10−2 Hz, all the plots obtained at different temperatures correspond to each other, but at very low frequencies (10−2 to 10−3 Hz), the magnitude of impedance decreases slowly with increases in the temperature.
The impedance of CPE can be defined as: where Z0 is the CPE constant, j2 = −1 is the imaginary number, ω is the angular frequency, and n is the CPE exponent (−1 ≤ n ≤ 1; Hang et al., 2010). Applying CPE, instead of pure capacitance, improves the fitness of EIS data to the experimental results. Depending on n, CPE can represent resistance (n = 0, Z0 = R) or capacitance (n = 1, Z0 = C; Valero Vidal and Igual Muñoz, 2008). Therefore, when n approaches to 1, as can be seen in these tests for both of the alloys, the CPE behaves as a non-ideal capacitor. The values of n are associated with the non-uniform distribution of current as a result of roughness and surface defects (Assis et al., 2006; Hang et al., 2010). The values of n for SS and Ni-Ti alloys at each temperature are given in Table 3. It can be seen that n values for Ni-Ti alloys are greater than SS alloys and are closer to 1. Therefore, maybe, the behaviour of Ni-Ti alloys is more similar to the non-ideal capacitor than SS alloys.
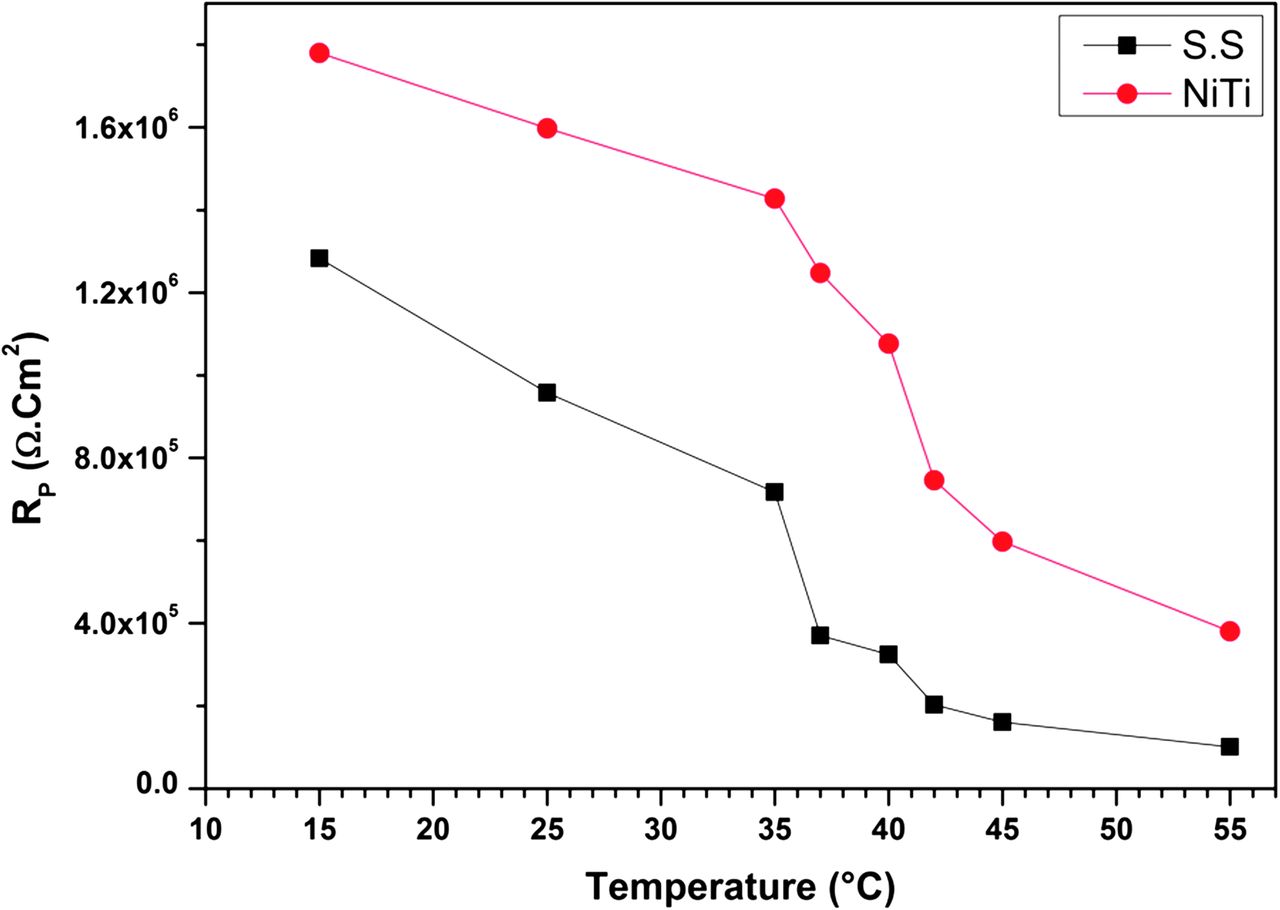
Figure 8 shows the plot of polarization resistance versus the temperature of the solution for both the alloys that have been used in this study. This figure clearly indicates the effect of temperature on the corrosion rate of these alloys. As noted earlier, with increases in the temperature, polarization resistance of alloys decreases, so corrosion rate will increase, but the rate of decreasing Rp values of Ni-Ti alloys as a function of temperature is faster than SS. So, it can be concluded that Ni-Ti alloys are more sensitive to temperature variations than SS alloys. In addition, differences between polarization resistances at lower temperatures are greater in comparison with higher temperatures for both alloys. However, in general, it can be seen from Table 3 that for all conditions at various temperatures, there are high values of polarization resistance (Rp) in the order of mega ohms (mega ohms per square centimetre) for both of the alloys, which implies a good corrosion resistance for these alloys.
Polarization resistance versus temperature of the solution for stainless steel and Ni-Ti alloys.
Although in vitro experiments reveal susceptibility of Ni-Ti and SS alloys to corrosion, especially pitting corrosion in Ringer’s or Hank’s solutions, these alloys can be safely considered for use in a saliva-like environment. This is because saliva is less corrosive than the saline or Hank’s/Ringer’s solution (Singh and Dahotre, 2007). If the corrosion rate is only controlled by the metal oxidation process, the corrosion rate will increase exponentially with an increase in temperature following an Arrhenius relationship. This is the true for exposing orthodontic appliances to physiological solutions at temperatures higher than normal body temperature. By increasing the temperature, the test is accelerated and can therefore be used in a laboratory setting to obtain information on materials corrosion resistance in a relatively short period of time. Furthermore, a change in temperature can also affect the resistance of a material to localized corrosion (pitting corrosion; Trépanier and Pelton, 2004).
The aim of this investigation was to obtain Ecorr and icorr for comparison purposes between SS and Ni-Ti alloys by using potentiostatic method (linear sweep voltametry) and also to compare the alloys according to their passive film behaviour, with the aid of parameters n and Rp determined by impedance measurements, but we can obtain further useful information about passive behaviour of the alloys by measuring Epitt, Eb, Erp, etc and also due to hysteresis loop from potentiodynamic measurements. This subject can be an area for future work in order to improve understanding of the electrochemical corrosion behaviour of the alloys in vitro.
Conclusions
Electrochemical corrosion behaviour of SS and Ni-Ti alloys was investigated and compared to each other in Ringer’s solution at temperatures in the range 15–55°C by electrochemical techniques. It can be seen that results obtained from impedance measurements are in agreement with that obtained from potentiostatic tests. Results showed that as the temperature of the solution increased, corrosion current densities of the alloys does too, but the polarization resistance decreased, which means that corrosion rates of the alloys increased. All tests indicate that Ni-Ti has greater resistance against corrosion compare to SS, even at higher temperatures than normal body temperatures (37°C); this is due to its compact and protective layer forms on its surface in Ringer’s solution. Although Ni-Ti corrodes in Ringer’s solution, its corrosion rate, especially compare to SS (about the order of 10−6), is not very high (about the order of 10−8).
Funding
Department of Materials Science and Engineering, Shiraz University (89-GR-Eng-58)
All the authors acknowledge the Shiraz University, school of material science and engineering for the financial support (grant no. 89-GR-Eng-58).

